Edit, Download, and Sign the Line Bar and Pie Charts Instructions and Template
Form
eSign
Add Annotation
Share Form
How do I fill this out?
To fill out this template, start by selecting your desired chart type. After that, input your data according to the format required by the selected chart. Finally, customize the chart settings as needed to match your visualization goals.
How to fill out the Line Bar and Pie Charts Instructions and Template?
1
Select the preferred chart type.
2
Input your data in the correct format for that chart type.
3
Explore and adjust the various chart settings.
4
Check the preview for accuracy and adjustments.
5
Finalize your chart and save or export it as needed.
Who needs the Line Bar and Pie Charts Instructions and Template?
1
Data analysts who require visual representation for reports.
2
Business professionals needing to present statistics effectively.
3
Educators looking for tools to teach data interpretation.
4
Researchers needing to showcase findings in a clear format.
5
Marketing teams wanting to analyze and illustrate performance metrics.
How PrintFriendly Works
At PrintFriendly.com, you can edit, sign, share, and download the Line Bar and Pie Charts Instructions and Template along with hundreds of thousands of other documents. Our platform helps you seamlessly edit PDFs and other documents online. You can edit our large library of pre-existing files and upload your own documents. Managing PDFs has never been easier.
Edit your Line Bar and Pie Charts Instructions and Template online.
Editing this PDF allows you to customize your charts effortlessly. You can modify data points, adjust visual settings, and update labels directly within our PDF editor. Use the features to enhance clarity and make your charts more informative.
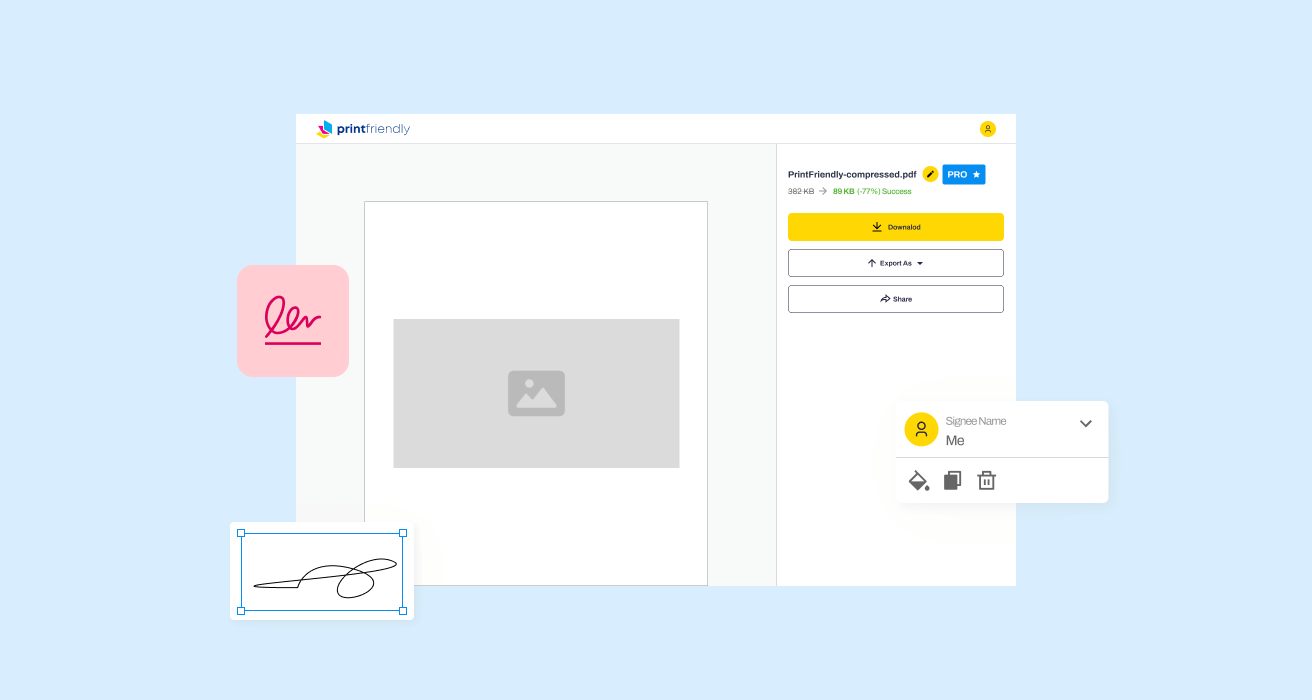
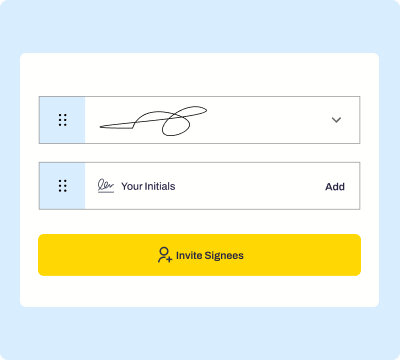
Add your legally-binding signature.
Signing this PDF can be done quickly using our platform. You can add your signature directly to the document, ensuring authenticity. This feature allows for easy approval processes without the need for printing.
Share your form instantly.
Sharing your PDF is simple with our platform. Once your document is edited, you can easily share it with colleagues or clients via email or direct links. It's an efficient way to collaborate on data presentations.
How do I edit the Line Bar and Pie Charts Instructions and Template online?
Editing this PDF allows you to customize your charts effortlessly. You can modify data points, adjust visual settings, and update labels directly within our PDF editor. Use the features to enhance clarity and make your charts more informative.
1
Open the PDF in the PrintFriendly editor.
2
Select the chart you wish to edit.
3
Make changes to the data or visual options.
4
Preview the adjustments to confirm accuracy.
5
Download or share the edited PDF as needed.

What are the instructions for submitting this form?
To submit this form, ensure all fields are filled correctly, then click the 'Submit' button. Alternatively, you can share via email by sending the document file as an attachment. Physical submissions can be done by printing the form and sending it to our mailing address, which is provided on the website.
What are the important dates for this form in 2024 and 2025?
Important dates for using this form will vary based on the project or presentation deadlines. Please ensure to double-check any specific timelines set forth by your organization or project leaders for consistent utilization.

What is the purpose of this form?
The purpose of this form is to provide users with an easy-to-fill template for various types of data visualizations. It allows individuals to input their data into predefined structures for effective representation. This form enhances the clarity and impact of presenting data, whether for business or educational purposes.

Tell me about this form and its components and fields line-by-line.

- 1. Chart Type: Dropdown to select line, bar, or pie chart.
- 2. Data Input: Fields to enter numerical and categorical data.
- 3. Customize Color: Options to set colors for data representation.
- 4. Legend: Toggle to display or hide legend for clarity.
- 5. Annotations: Field to add notes or highlights in charts.
What happens if I fail to submit this form?
If you fail to submit this form, your changes will not be saved, and you may lose any adjustments you have made. It's crucial to ensure that all required fields are filled out accurately before submission. Double-check your data input to avoid submission errors.
- Incomplete Data: Missing data in required fields can cause submission to fail.
- Formatting Issues: Data not entered in the correct format may lead to chart generation errors.
- Browser Compatibility: Ensure you are using a supported browser to prevent technical issues.
How do I know when to use this form?

- 1. Business Presentations: Use the form for visualizing business data in meetings.
- 2. Educational Reports: Great for students presenting research findings.
- 3. Analytics Reports: Ideal for analysts who need to present data insights.
Frequently Asked Questions
What types of charts can I create with this template?
You can create line, bar, and pie charts using this template.
Can I customize the colors of my charts?
Yes, the template allows for extensive customization options, including color settings.
Is it possible to combine multiple chart types?
Yes, you can create grids of charts to display related data together.
How do I input my data into the template?
Input your data in the specified format according to the selected chart type.
Can I save my charts once created?
Yes, charts can be downloaded as PDFs after editing.
Is there support for adding annotations?
Yes, you can add annotations to your charts for better clarity.
Can I adjust the size of my charts?
Yes, the template allows for adjustments in chart size within the settings.
Are there preset templates I can choose from?
Yes, there are various chart type presets available in the template.
How do I share my finished charts?
You can share your charts via email or direct links from our platform.
What if I encounter issues while using the template?
Feel free to reach out for support, and we will assist you with any concerns.

